WEBSITE PLAYBOOK
Chapter 6: Reporting that
powers dealer strategy
You already track key metrics like unit sales, gross profit, service ROs, and CSI scores to monitor how your dealership is performing. Your website deserves the same level of focus. With the right reporting strategy in place, you can clearly see which pages and tools are driving shopper engagement, where visitors are dropping off, and how your site is contributing to lead generation and sales performance.
Instead of guessing what’s working online, your data gives you the clarity to adjust strategies, track emerging trends like AI-driven traffic, and stay competitive in a fast-moving market.
In this chapter, you’ll learn how to:
- Track the metrics that actually matter for dealership profitability
- Identify quick wins that can improve performance
- Introduce how you can track your AI traffic
- Build a reporting rhythm that keeps your site competitive
Website performance KPIs
The KPIs that matter most are the ones that show how well your site engages high-intent shoppers, converts them into leads, and supports your team’s ability to close deals. These are the website-specific performance indicators to prioritize — and each can be tracked directly in Google Analytics 4 (GA4).
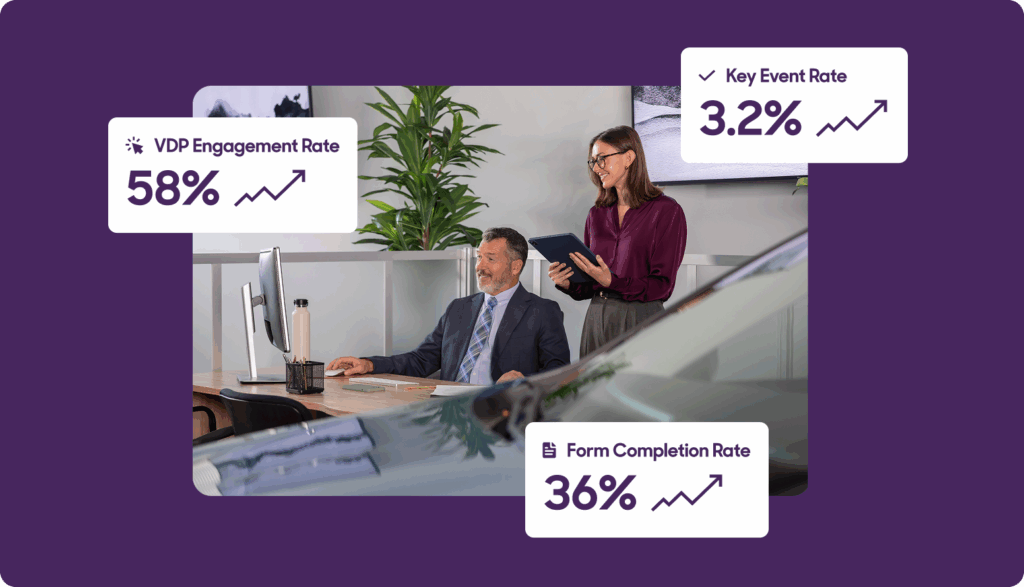
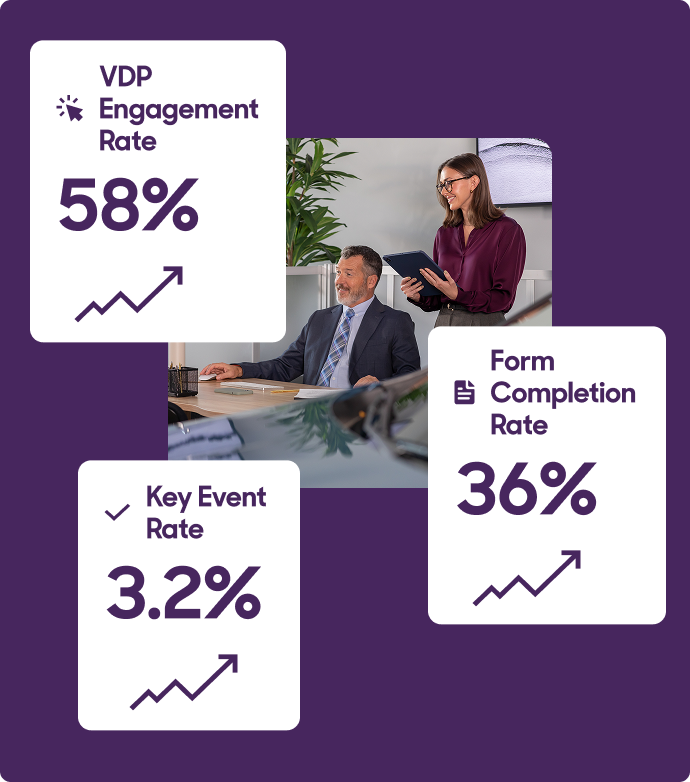
Key Event Rate
Measures the percentage of site visitors who complete high-intent actions like submitting a form, making a call, or starting a chat.
- Why it matters: It’s your clearest signal of whether your site is generating real sales opportunities.
- How to use it: Compare performance across form types (trade, service, contact) to identify which departments or lead sources have the most growth potential.
Form Completion Rate
Tracks how many users complete a form after starting it — helping you identify friction in your lead funnels.
- Why it matters: Long or confusing forms often create unnecessary drop-off, especially on mobile.
- How to use it: Break down by form type and device to guide testing and simplification efforts.
VDP Engagement Rate
The percentage of VDP sessions that meet at least one key condition: lasting over 10 seconds, triggering a conversion event, or including 2+ page views.
- Why it matters: Strong engagement on VDPs signals pricing, photos, and merchandising are connecting with real buyers.
- GA4 Setup Tip: To track this in GA4, filter for the asc_item_pageview event, which is triggered when a VDP is viewed.
Scroll Depth
Measures how far down the page a user scrolls — a direct signal of content engagement.
- Why it matters: Shallow scrolls suggest content isn’t compelling or layout is pushing users away.
- How to use it: Prioritize improvements on key pages (homepage, VDP, SRP) where engagement drop-off directly impacts lead flow.
Device-Specific Performance (Mobile)
Monitors views, engagement, and conversions across device types, especially mobile.
- Why it matters: Over 60% of dealership site traffic comes from mobile. Poor mobile performance drives bounce and missed opportunities.
- How to use it: Monitor mobile load times, session duration, and event performance through GA4 and GTM. Prioritize fixes on high-traffic pages.
Views Per Session + Session Duration
These are supporting metrics that help contextualize user engagement and intent.
- Why it matters: More page views and longer sessions often mean shoppers are actively considering — especially when paired with Key Events.
- How to use them: Use as directional signals, not core performance metrics.
Pro Tip
Track AI search traffic in GA4
AI-powered platforms like ChatGPT, Perplexity, Gemini, and others are now citing dealership websites directly in their answers — and sending real traffic in the process. But unless you’re tracking it, that visibility (and opportunity) is invisible in standard GA4 reports.
Here’s how to surface that traffic with a custom GA4 segment:
How to Set Up AI Traffic Tracking in GA4
- In GA4, go to Explore and create a new Exploration report.
- Set Session source/medium as your dimension.
- Add metrics: Sessions, Engaged sessions, and Key events.
- Create a new Session segment and name it: “AI & LLM Traffic”
- Use this regex filter for the session source:
(chatgpt|openai|perplexity|gemini.google|copilot.microsoft|claude|grok)This filter captures referrals from major AI platforms. Update it as new tools emerge to keep your data current.
Conversion enablement metrics
Website KPIs tell you how effectively you’re capturing demand. But what happens after a shopper submits a lead is just as critical. Conversion enablement metrics help you understand whether your team is turning those opportunities into outcomes.
These aren’t traditional website KPIs — they live in your CRM and showroom, not in GA4. But they’re essential for diagnosing misalignment between your digital strategy and in-store execution. Use them to identify breakdowns in follow-up, pressure-test lead quality, and uncover gaps that could be costing you deals.
Lead-to-Appointment Rate
Tracks the percentage of website leads that convert to scheduled appointments.
- Why it matters: Low appointment rates may indicate poor lead quality or breakdowns in your follow-up process.
Show-to-Close Rate
Measures how many appointments turn into actual sales.
- Why it matters: If this rate is low, the issue is likely offline — either in process, pricing, or sales execution.
Cost Per Lead (CPL)
Your total marketing spend divided by total leads generated.
- Why it matters: A good CPL is only meaningful when the leads are converting — so always pair this with quality and close-rate metrics.
Pro Tip: Run these same metrics for all your lead sources — third-party, social, paid — to reveal where your strongest leads are coming from and where follow-up processes might be breaking down. Comparing performance side by side helps you separate lead quality issues from operational ones.
That’s why these metrics matter in any conversation about website performance. They give you the confidence to present a complete picture — showing not just how your website is performing, but where breakdowns may be happening after the handoff. Strong website engagement paired with weak follow-up or low appointment show rates reveals an operational issue, not a marketing one. With this data in hand, you can shift the conversation from “Are the leads any good?” to “Where are we losing the ones we already have?”
Turn performance signals into strategic actions
Here’s your diagnostic guide for turning underperformance into strategic action. Each “if” represents a signal — and the “then” tells you how to respond.
| KPI | If | Diagnosis | Then | Tool to Use |
|---|---|---|---|---|
| Organic Traffic | flat or declining | Check for outdated content, declining keyword rankings, technical SEO issues, or local SEO | Refresh SEO strategy, update blog content, and review local keywords | DI reporting platform + GA4 (Acquisition > Traffic acquisition report) |
| Pages per Session | < 3 pages | Review average engagement time per active user to give you a comprehensive view of how long users are engaging with your site. | Add personalization blocks (Recently Viewed, Recommended Vehicles) | GA4 Exploration report + “Views per Session”metric |
| Lead Form Conversion Rate | Sustained drop | Assess form length, number of required fields, mobile usability, or unclear value proposition | Shorten forms, reduce fields, and test mobile usability. Also ensure any non-DI forms are pushing events to GA4 | Shorten forms, reduce fields, and test mobile usability. Also ensure any non-DI forms are pushing events to GA4 |
| Chat Engagement | High volume, low leads | Review chat prompts for clarity, agent response quality, or lack of proactive engagement strategies | Refine AI prompts, improve agent follow-up, and add proactive chat offers | DI reporting platform or Chat tool reporting (conversation-to-lead rate) |
| Service Scheduler Submissions | High visits, low completions | Identify required field friction, or unclear appointment availability | Streamline UX, show next available appointment, simplify steps | GA4 (Events report filtered by asc_comm events) |
| Site Speed (Load Time) | Long load times | Identify large uncompressed images, render-blocking scripts, or server response issues, and audit scripts on site | Compress images, remove unused scripts | Website Health Report |
Making reporting work for your dealership
Data is the most impactful when it drives action. The best reporting frameworks connect insights to decisions, creating a continuous improvement cycle.
- Start with the metrics that align most closely with your dealership’s goals. If lead volume is your priority, focus on conversion rate optimization and traffic source performance. If service revenue is the focus, emphasize scheduler submissions and service content engagement.
- Use the tools available to you. DI’s platform reporting for dealership-specific insights, Google Analytics for comprehensive journey tracking, and VDP-level analytics for inventory intelligence. No single metric tells the complete story. Layer them together for full visibility.
- Implement the fast fixes checklist when performance gaps appear. Small improvements compound over time.
- Build organizational rhythm around reporting within your team. Monthly reviews, weekly checks, and real-time campaign monitoring create accountability and responsiveness.
Remember: your website is never finished. Shopper behavior evolves, competition intensifies, technology advances. The dealers who treat reporting as an ongoing strategic practice rather than an occasional check-in are the ones who maintain digital advantage.
📄 Get the Quick Reference Guide
Download the condensed PDF version of Chapter 6, packed with the Fast Fixes Checklist and essential KPI definitions. Perfect for your monthly performance reviews.
Download the Quick GuideNot with Dealer Inspire?
See how our websites come with built-in reporting tools and expert support that helps you turn data into dealership strategy.
