EXPERT ARTICLE
From views to VINs: How to measure video
advertising ROI at your dealership

Video advertising has always been hard to measure, even for experienced marketers. Impressions, views, and clicks confirm an ad was served or watched, but they don’t show what happened after. Real measurement connects that exposure to the two outcomes that actually matter to your bottom line: whether the shopper visited the lot, and whether they bought.
Here’s the framework behind that answer, and what it should change about your next budget conversation.
Why is video advertising ROI so hard to prove?
Because standard reporting stops at exposure. We’ve been conditioned to judge performance by impressions, views, and clicks. But those metrics only tell us that an ad was served or watched, and not what actually happened afterward.
Every budget review has some version of the same moment: someone asks what the video line did, and the answer is impressions, maybe a click-through rate. It’s an unsatisfying answer for everyone in the room because the standard toolkit was never built to follow a shopper past the screen.
That gap between what gets reported and what happens offline is bigger than most realize. Dealers spent an average of $722 per vehicle sold on advertising in the first half of 2025. Yet in a sample of 875,000 vehicle sales, Clarivoy found that 92% were untraceable in CRM. If a shopper watched a video and visited the lot three days later, standard reporting has no way to connect those two events. The sale looks like it came from nowhere, and the campaign that helped drive it gets zero credit.
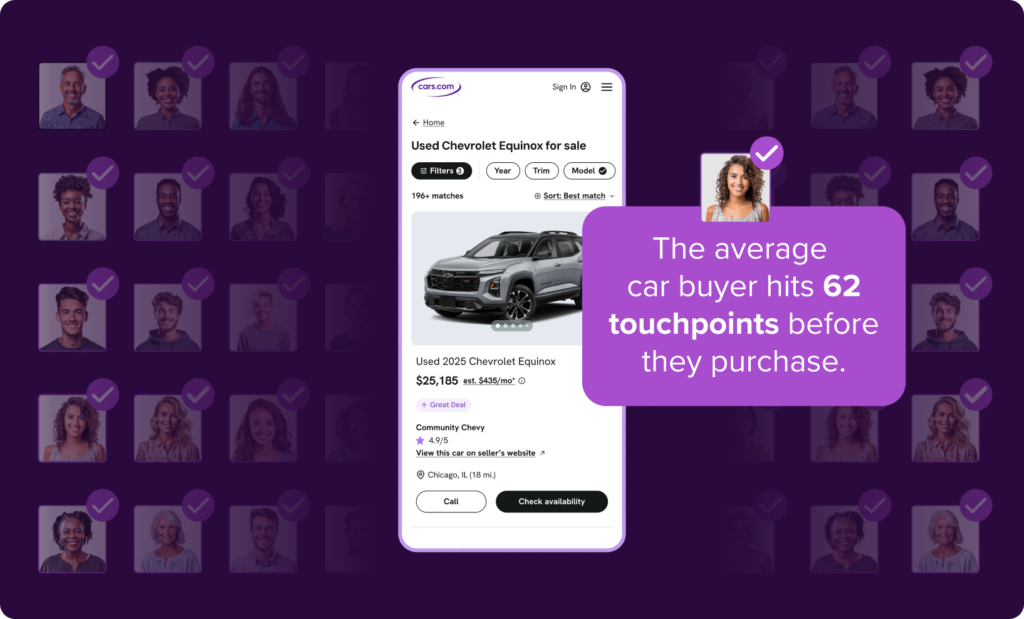

Zoom out to the full shopper journey, and the gap widens further. The average car buyer hits 62 touchpoints before they purchase. That gap comes down to how most tracking tools are built: they’re designed to credit only a couple of interactions along the path, capturing roughly 3.5% of everything that actually influenced the sale.⁴
Put plainly: that’s a $50,000 decision being made on a sliver of the actual picture.

Key takeaway: Most video reporting stops at exposure. Closing the gap means measuring what happened after the view: whether shoppers visited the lot, and whether they bought.
What’s the real gap in dealership advertising attribution?
The gap is accountability. Impressions are easy to report and impossible to argue with. Lot visits and sales are harder to prove and worth far more, which is exactly why most media providers stop at the easy number.
That’s worth putting to any vendor directly, before the next renewal:
- How many lot visits did a campaign influence?
- How many of those visits led to a sale?
- Is that answer modeled, or tied to actual VIN-level outcomes?
If a vendor can’t answer all three, they’re measuring exposure and calling it ROI.
Key takeaway: Ask your media vendor these three questions before your next renewal. If they can only answer the first one, you’re paying for impressions with no proof attached.
How does In-Market Video reporting close the attribution gap?
Cars.com In-Market Video (IMV) closes it by reporting lot visits and vehicle sales tied to actual campaign exposure, not modeled estimates.
IMV adds lot visit attribution directly to campaigns. Instead of stopping at “this ad was viewed,” dealers see whether the households that saw it actually showed up. IMV builds on that, adding influenced new and CPO vehicle sales reporting on top of lot visit data, so dealers can see not just who visited, but whose visit connects to an actual sale.
What separates this from a modeled estimate is how it’s built: deterministic, VIN-level data tied to real, observed outcomes, with full dealer coverage across major brands.
| What standard media reporting shows | What In-Market Video shows |
|---|---|
| Impressions and views | Verified lot visits tied to campaign exposure |
| Click-through rate | Influenced new and CPO vehicle sales |
Key takeaway: Match the level of proof to what your next budget conversation actually needs: visibility into foot traffic, or the full line from view to sale.
What does automotive video campaign performance look like with attribution turned on?
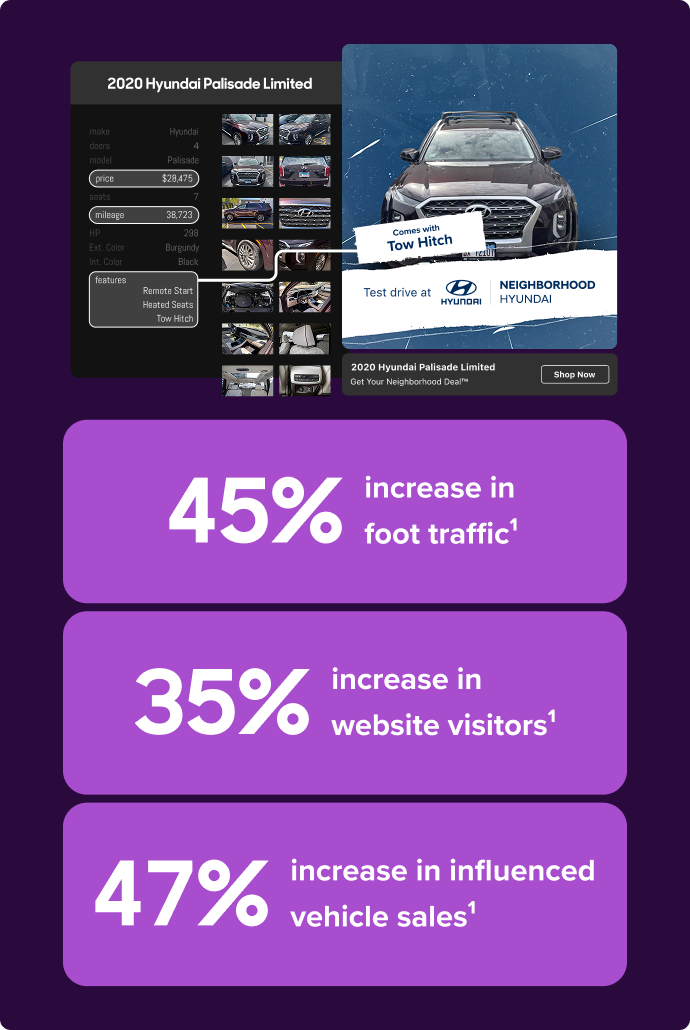
It looks like verified lift, not just delivered impressions. In the first 30 days of a live campaign using VIN-specific AI video creative, dealers saw a 35% increase in website visitors, a 45% increase in influenced foot traffic, and a 47% increase in influenced vehicle sales versus the prior period.3
The efficiency case holds up too. IMV viewers visit 3.4x more dealer website pages than other site traffic4, a sign that video’s value extends past awareness into deeper engagement that view counts never capture. VIN-specific video ads also drive 2x more website leads than static creative,¹ at a 34% lower average ad cost than other digital providers.²
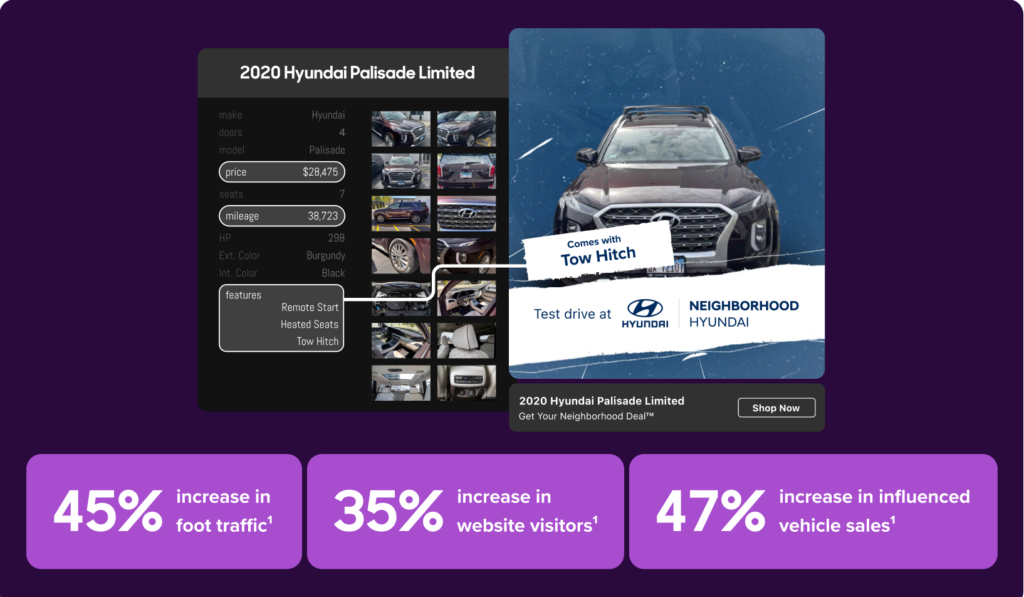
One important note on how to read this data: this is attribution measuring influence, the role video played across a longer path to purchase. A buyer’s 62 touchpoints all contribute to a sale. This reporting shows where video fit into that path and how much it moved the needle. It doesn’t claim video alone closed the deal, which is a more useful way to read the data, because it reflects how people actually shop.
Key takeaway: Video already earns its efficiency case on these numbers alone. Attribution is what lets you prove it in the next budget review.
A gut-check before locking in next quarter’s budget
Before the next planning cycle, run the current video spend through a short filter:
- Can you name how many lot visits your video campaigns influenced last quarter?
- Can you connect any of those visits to a closed sale?
- Is that answer coming from modeled data, or from VIN-level outcomes you can actually verify?
- If your media vendor can’t answer these, do you know why?
Answering “no” or “not sure” more than once means the video budget is being defended with the same two data points as everyone else’s.
The smartest path from search to sold starts with proof
Before you finalize next quarter’s media plan, see what IMV could show you. It’s a faster way to prove video ROI than defending a line item with nothing but a view count.
1 National Automobile Dealers Association (NADA), H1 2025 dealer advertising spend data
2 Clarivoy attribution data, July 2025 (sample of 875,000 automotive sales)
3 Cars.com Case Study: In-Market Video Campaign Performance with new VIN-Specific AI creative assets compared to prior period without new product capabilities, March-April 2026
4 Cars Commerce Case Study, Q4 2024

)